History Viewer
Creator
The problem
I wanted to learn how two new Claude products work under the hood: Dashboards, which turns a question into a board that keeps itself up to date, and Motion, which turns a report into an explainer video written as code. Reading about them wasn't enough; I needed to build something with the same mechanism and real data.
History was the ideal ground. Wikipedia has the data — what happened on each day of the year, what happened each year, full timelines of topics like aviation — but presents it as long lists that hide the shape of time: where events cluster, which ones matter most, how one era connects to the next.
The solution
The ClaudeDataViz repository has three parts. The first two are small, dependency-free HTML examples: a mini dashboard where each widget remembers its own query and refreshes at its own pace, and an animated explainer where the video is a pure function render(scene, t) exported frame by frame.
The third is the History Viewer, a Next.js app that queries Spanish Wikipedia live and has three views:
- Day — everything that happened on, say, July 20, from the year 70 to today, on a centuries-long timeline with density by category.
- Period — what happened in a given year, month by month.
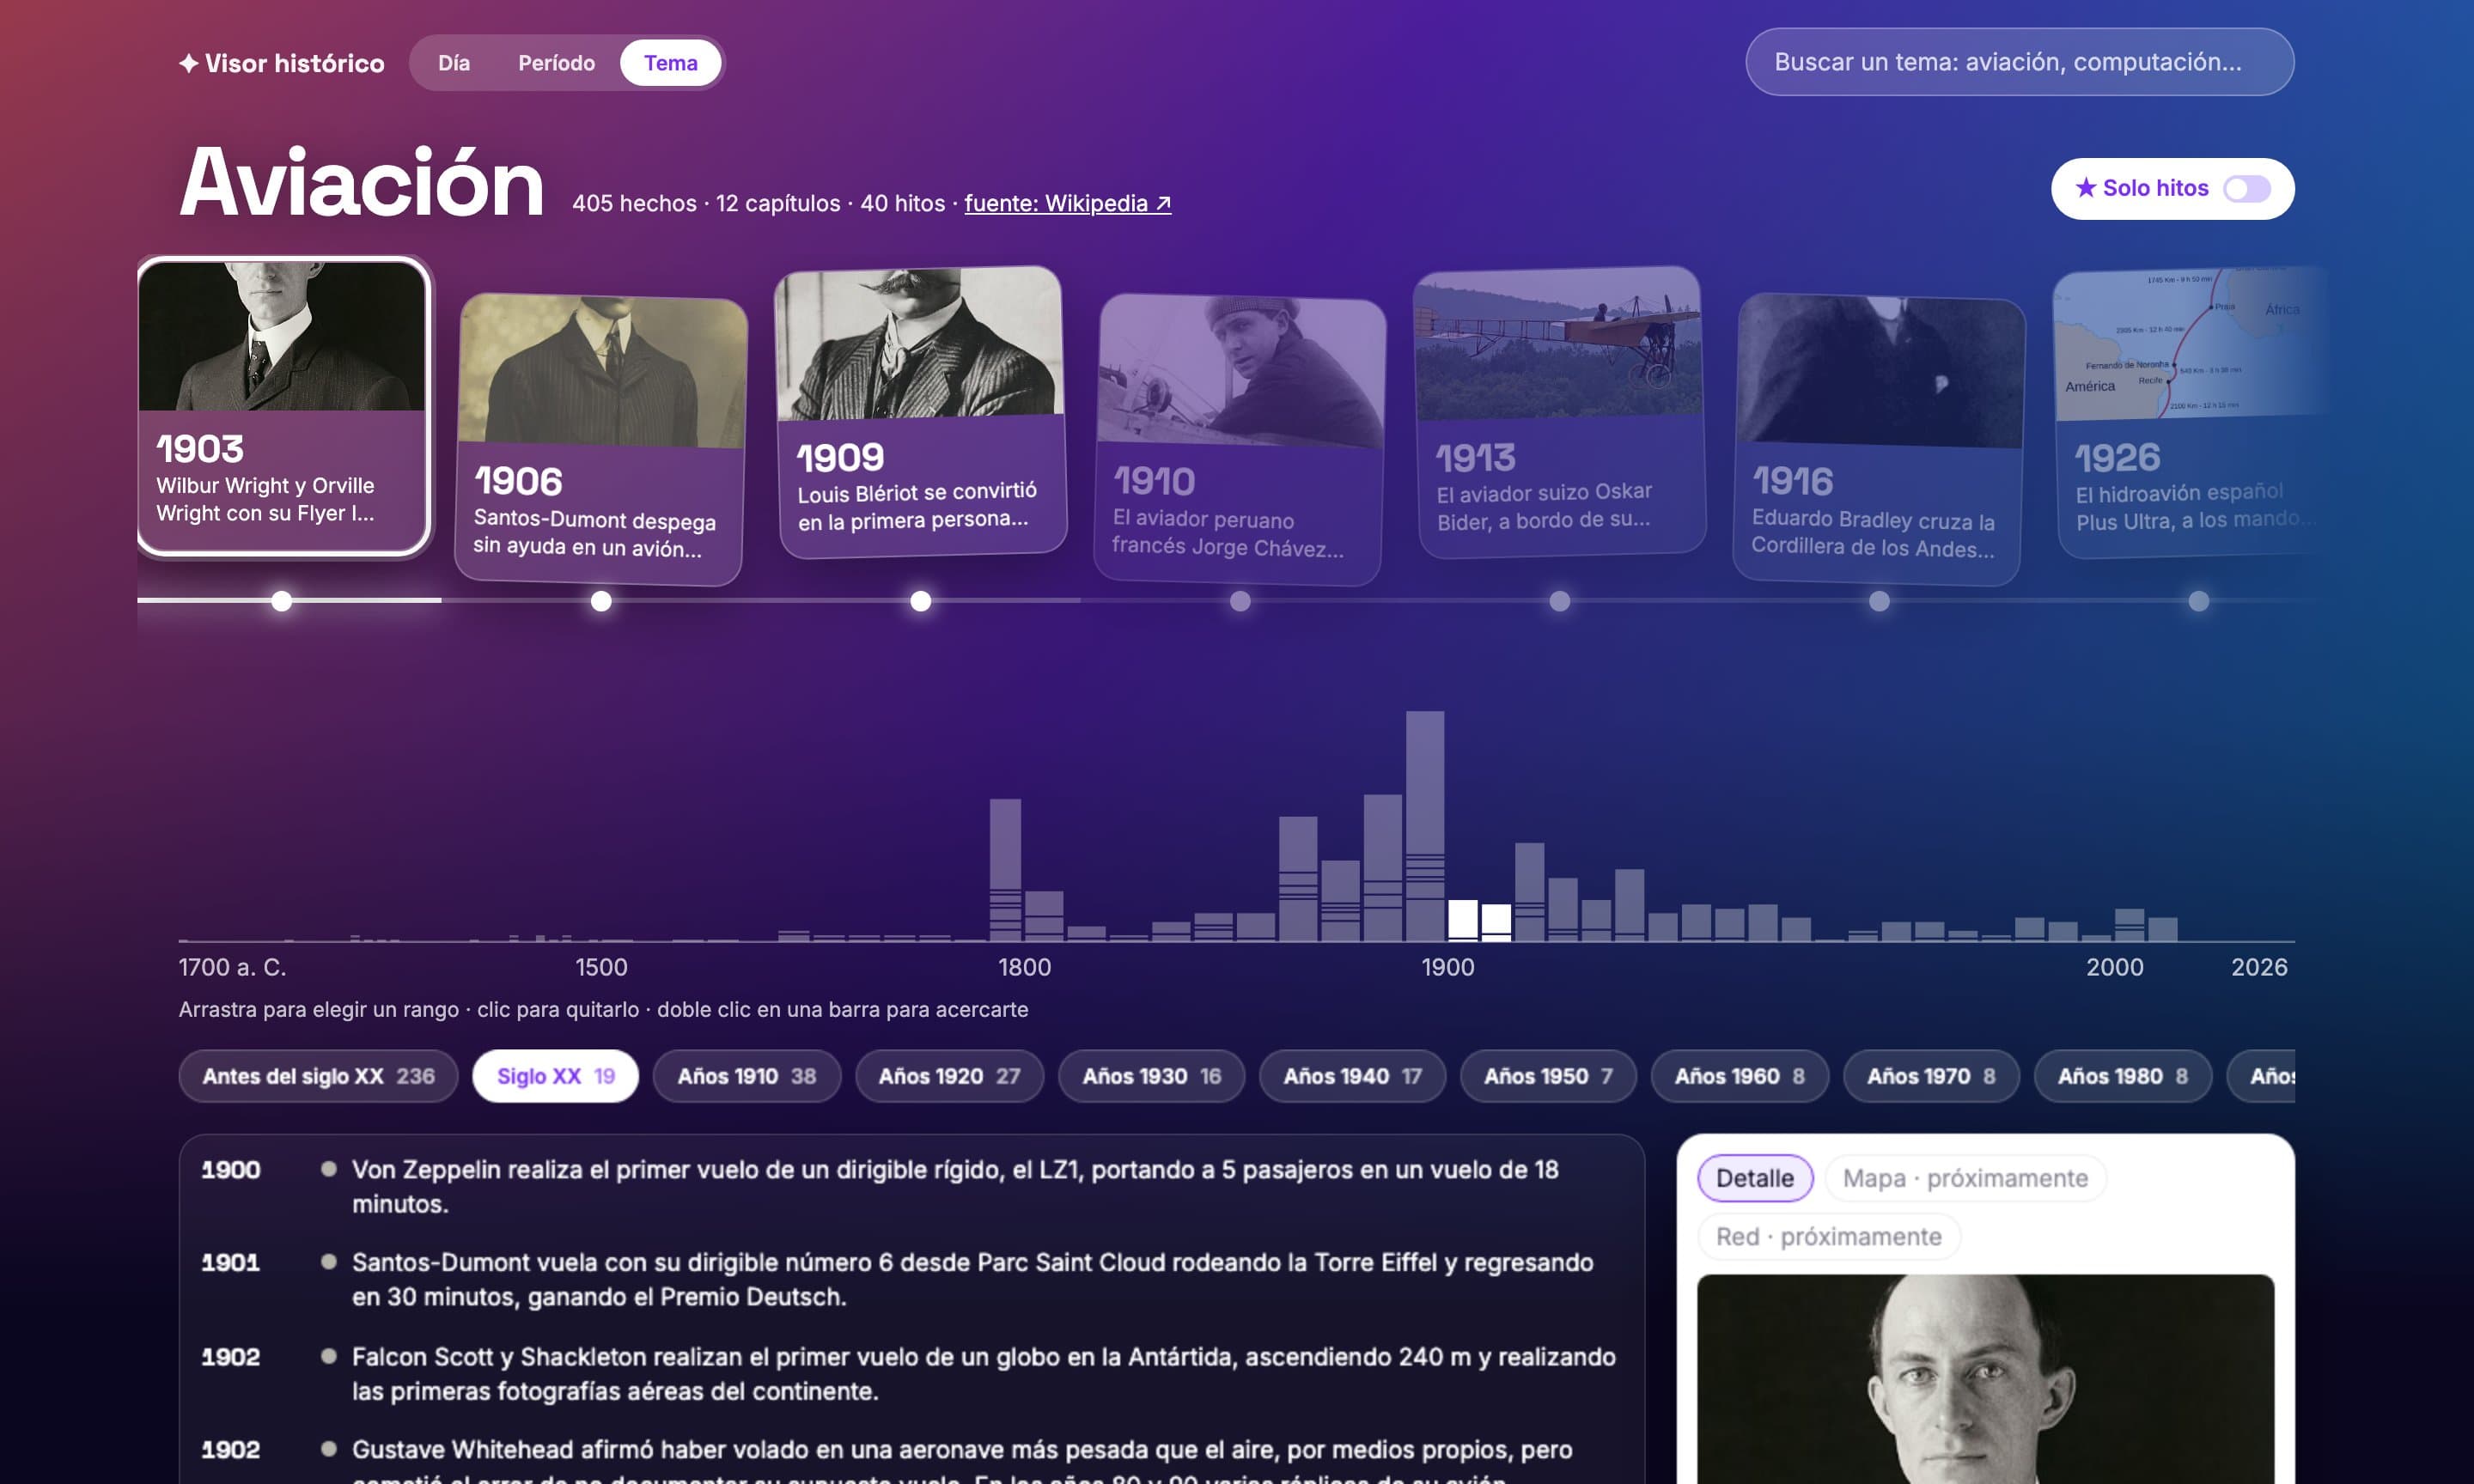
- Topic — type «aviación» and get its evolution: chapters taken from the sections of the Wikipedia timeline article, a panoramic strip of milestones with their photos, and the full list below.
Dragging across the timeline filters a range, a chapter is a range of years, and all state lives in the URL: sharing a link takes someone straight to "aviation milestones of the 1920s".
Technical decisions
Read Wikipedia's rendered HTML, not wikitext. Every timeline article uses different templates; Parsoid's HTML has them already expanded. Even so, the parser had to learn formats that only showed up with real data: sortable tables for ancient centuries, lists split by an image, bold years without a colon. The rule that governs it: place every event or count it as discarded, never invent a year ("1.000 aviones" and "747-400" are not years).
Importance is not popularity. Milestones are chosen from the page views of linked articles, but with views alone any event that mentioned a country beat the Wright brothers' first flight: "España" gets 161,357 views in 30 days; "Wilbur Wright", 474. We tested eight formulas against real data; neither frequency within the topic nor coordinates helped. What worked was a second signal: the Wikidata short description ("country in Europe" versus "American aviator"), which says what each article is.
An aesthetic designed for reading, not just for show. The Topic view uses a vivid gradient with glass cards and a glowing line that lights up to the selected milestone, but text contrast was measured (white on the gradient's extremes was 2.0:1; a veil brings it above 4.5:1), it honours prefers-reduced-motion, and the strip is keyboard-navigable.
Tests on real data, and an independent review. Tests use real Wikipedia responses recorded as fixtures. A final review by a separate agent found that the page-view API returns data in parts and the code never asked for the rest: 84% of articles scored zero, and the fixture had been recorded with the same bug, so the tests still passed.
Results
- 141 unit tests and 9 end-to-end tests; the aviation timeline comes out at 405 events, 12 chapters and 40 milestones, with nothing discarded.
- With the final formula, the Wright brothers' first flight, Lindbergh, Blériot and Santos-Dumont are milestones; before, only one of seven key events was.
- The most valuable part was what the project taught about the two products that inspired it: a dashboard isn't an image but a set of queries that re-run, and a Motion video isn't footage but a scene that re-renders. Claude doesn't hand you a frozen result, but the program that produces it.